
Related Posts


This past month, I put together a new utility, SyslogTally, because I needed to easily and quickly answer a question pertaining to how frequently various scripts were being used in my environment.
Original Need
This question about script usage frequency first arose back in June 2020, while trying to identify which scripts should be considered core to the BrainWave Scripting Repository, and which should be considered more ancillary. I determined that one of the easiest ways to establish a definitive answer would be to setup a local syslog server on a typical system, and then modify a core script (SetDrive.BAT) so that it would write to this local syslog whenever a relatively major script was initiated.
Initially, I selected TFTPD32 as the syslog server of choice, because it is small, easy to configure, comes in 32-bit or 64-bit editions, and runs as a service on Windows.
Then I whipped up a quick Windows shell script to parse the resulting logfile and give me a summary of jobs executed.
Issues Arise
This quick automation activity provided a great deal of insight (visibility is key!) about what was running from the repository, and at what frequency.
But, as the syslog grew in size, processing started to slow down quite a bit. Not the overall system – just the log parsing activity, which I was running on demand.
After just a couple hundred thousand KB (or a couple of weeks of normal activity), it started to take over a minute to parse the logfile. And once we got to a month of activity (1-2MB logs), I was seeing processing times exceeding 7 or 8 minutes on a relatively modern system. It didn’t make sense.
By now, I was hooked on the data I was obtaining, but I couldn’t see what was causing the slowdown. I was, however, able to isolate it to the initial parsing of the file to get the job/script names, so I decided to write a utility that would do this first round of parsing for me, and just hand that info back to the shell script to complete the counting.
Enter SyslogTally

Since much of this code was similar to what was already being used for ReadConfig.exe, it didn’t take long to get that first round of parsing done.
And the results were just as encouraging as the shell script performance had been confusing. When using SyslogTally to grab the relevant job/process name from each relevant line in the syslog, the script that would otherwise take 7 or 8 minutes, completed in 4 or 5 seconds.
I still have no idea why the native shell processing slows down exponentially as the log size grows, but it is clear that taking away the initial parsing duties was a great idea.
The shell script automatically resulted in an alphabetically sorted list, which made it hard to identify when a new script had been executed. Also, sorting required more external processing and made the shell script slightly more complex. I also realized that some of the features I was supporting in the shell script, were better supported in the utility natively.
So I made the decision to just put all that functionality into SyslogTally directly. And since I was going to go there, I decided to test out a bunch of free syslog servers for Windows, and add native support for them as well. Not everyone might want to go with TFTP32D, and I myself am running Kiwi Syslog Server elsewhere in the environment.
Broad Syslog Support
I ended up testing a number of syslog servers for Windows, settling on those that were popular — most of which were free (or had a free/trial edition) — and that wrote their logs to a flat text file.
Presently, SyslogTally supports the following syslog server:
And, since I was already doing a whole lot of work with configuration parsing, SyslogTally also supports a custom syslog mode where you can stipulate how to parse the file and which entries to summarize/tally. Based on all that testing I did, I ended up switching to NXLog as the default syslog for this function, based on a variety of reasons, including: ease of configuration, support for TCP and UDP, custom port configuration, and automatic roll-over configuration.
Custom mode means that you can use SyslogTally with other syslogs (or application logs in general) for which it does not have native support, or you can use it with otherwise supported Syslog servers to capture things that you care about that are different from what I was looking in tracking.
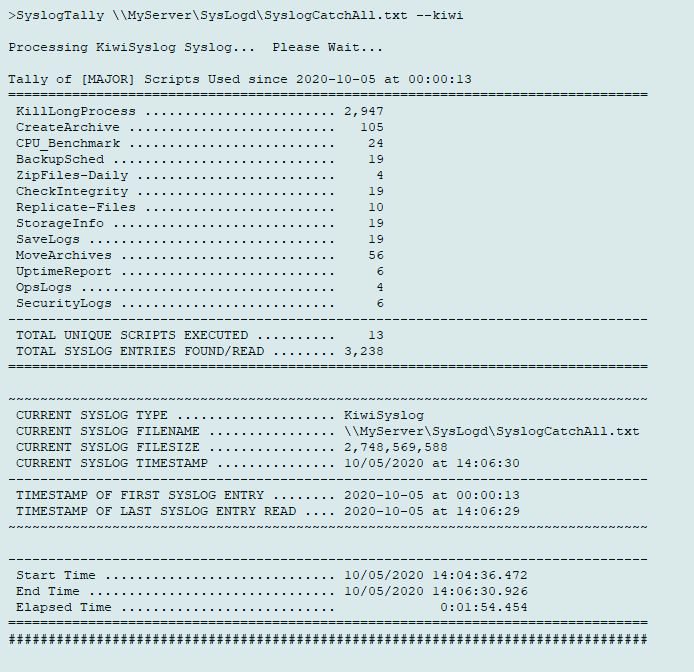
Using the script, I can now go through a 2MB logfile in less than a second, and a 2GB logfile in less than 2 minutes (see above). And that’s before any of the other filtering options come into play.
Feel free to take a look and see what you think of both SyslogTally and its companion ScriptUsage script.